How to create border maps for your projects
When working with data projects it is usual to use administrative maps. In my experience is not trivial to find the cartographic files as open access or opensource data sources, so after some search I found a method to create an ad-hoc map for any administrative region coded into OpenStreetMap. It’s not a trivial method but it is no as complex as it seems at first sight. I’ll try to introduce the essential concepts to easy understand the recipe. If you know other methods as good or better than this please give me some feedback.
I used this method with geodata for Spain so I guess it works with any other administrative region coded in OSM.
First you need to know an OpenStreetMap concept: the relation. In our case we’ll use multipolygon relations, used to code the borders of areas of our interests. The important thing to remember here is you are going to use an OSM relation.
Second you’ll want to select the region of your interest and you’ll need to figure out how it has been mapped in OSM. So you need to find the related OSM relation. As example I’ll use Alamedilla, my parents’ town in the province of Granada, Spain.
the method
Go to https://www.openstreetmap.org and search for the region of your interest. For example Alamedilla:
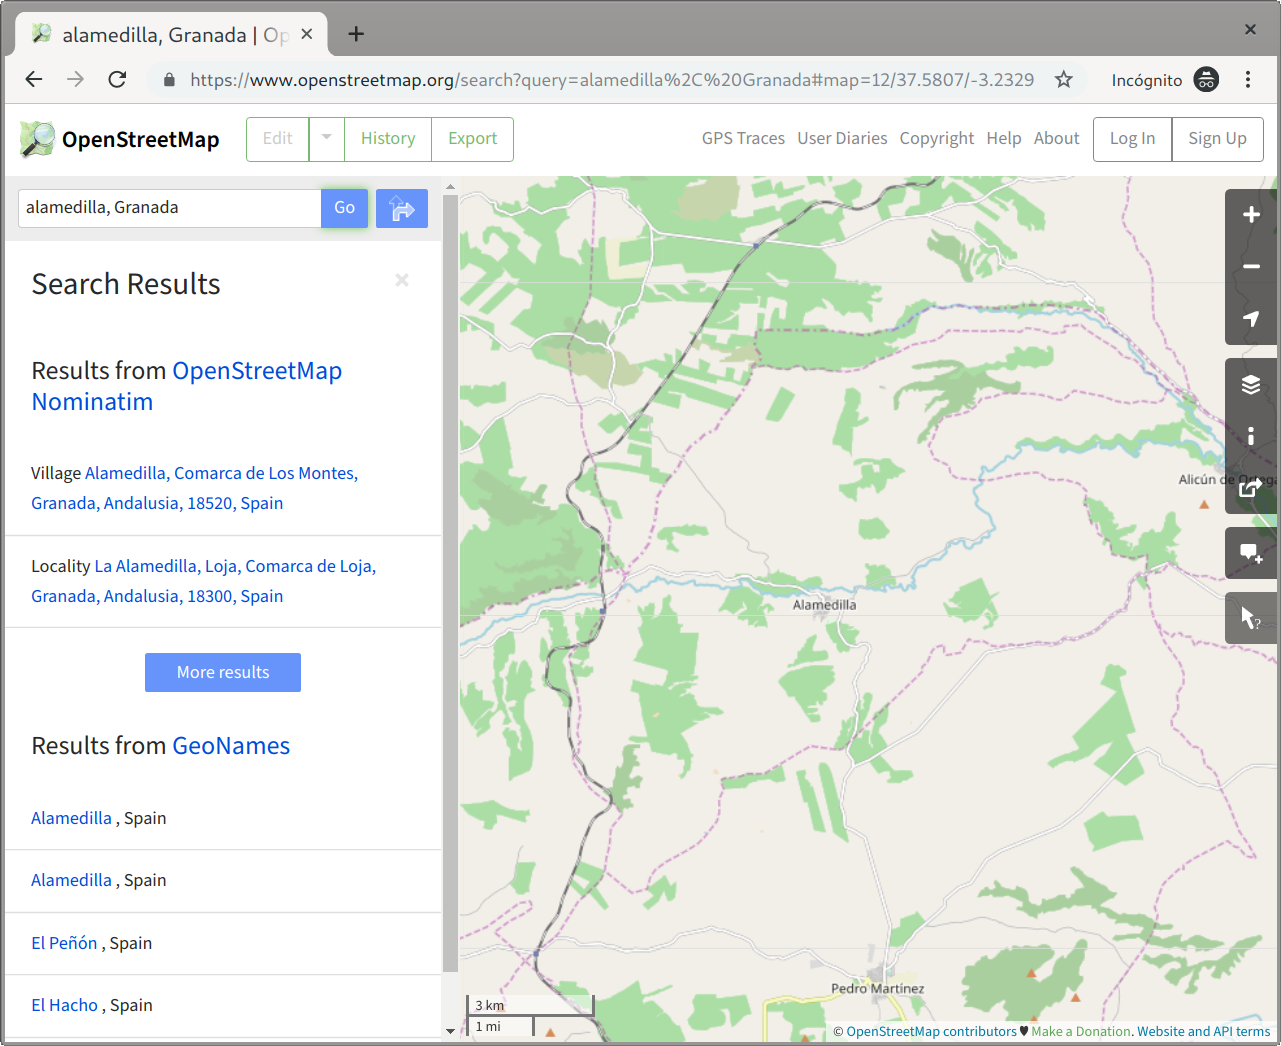
Click to the correct place and you’ll see something like this:
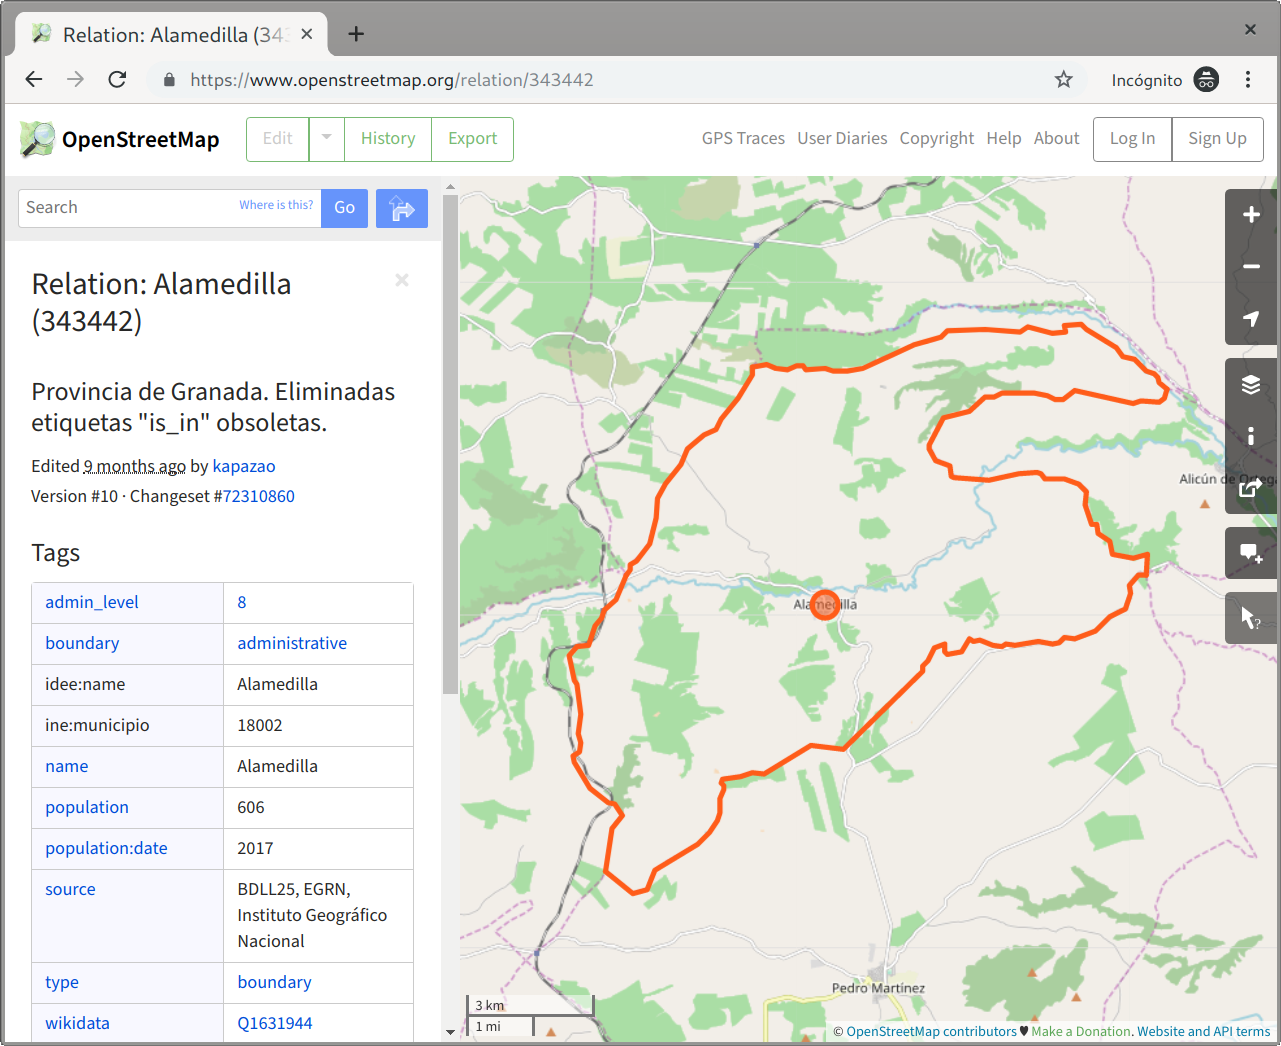
Look at the URL box at the browser and you’ll see something like this: https://www.openstreetmap.org/relation/343442. The code number you need for the next steps is that one in the URL after the relation keyword. In this example is 343442.
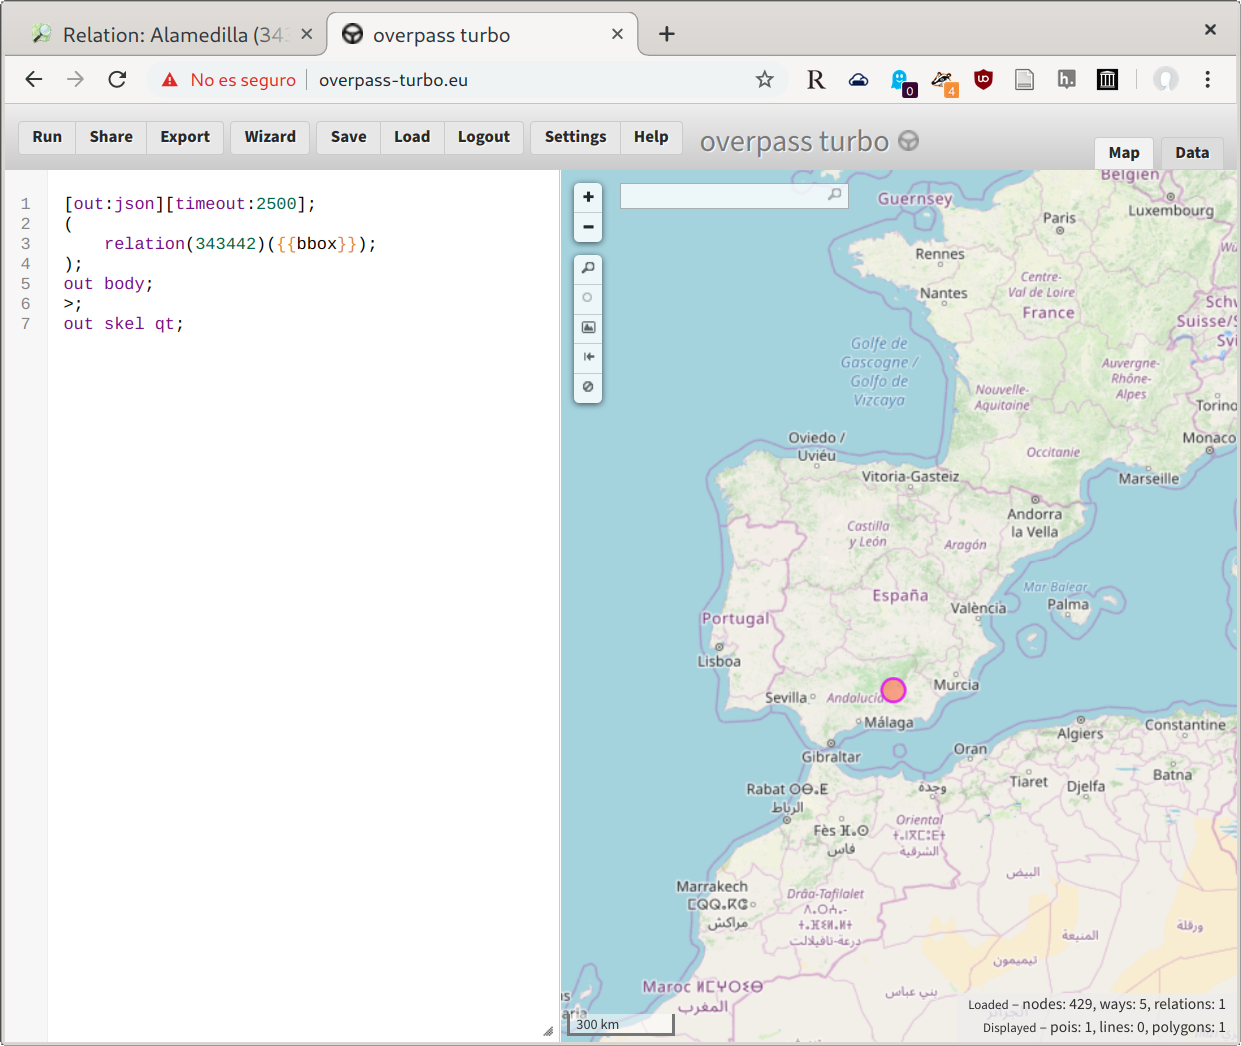
Then visit the to overpass turbo service, a powerful web-based data query and filtering tool for OpenStreetMap:
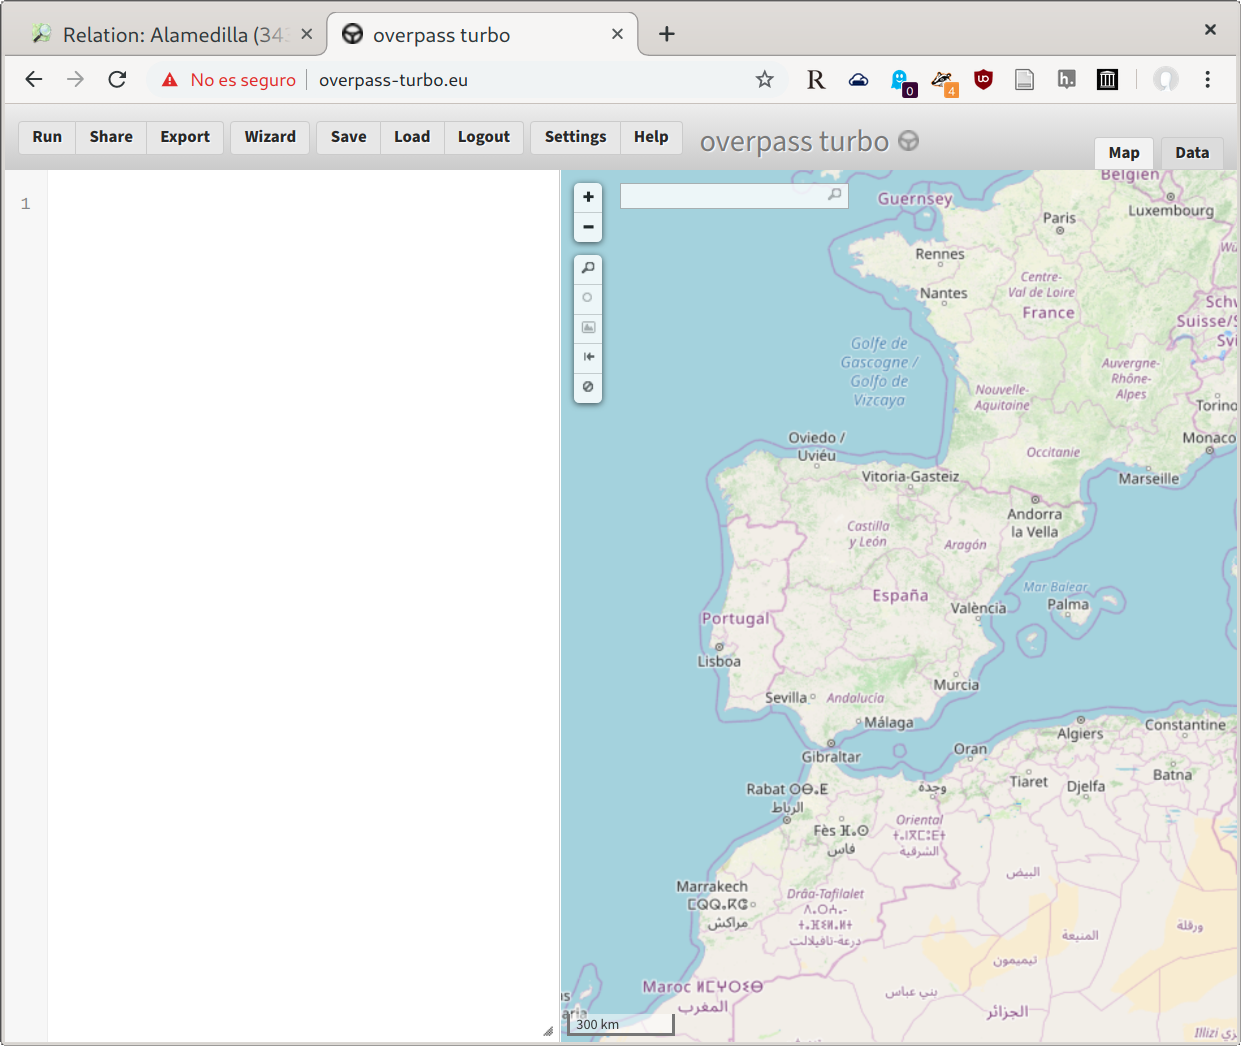
The white box at left is where you write the code of your query for Overpass. You have a wizard tool in the menu but it’s not trivial too. Instead you could copy exactly this code:
[out:json][timeout:2500];
(
    relation(343442)({{bbox}});
);
out body;
>;
out skel qt;
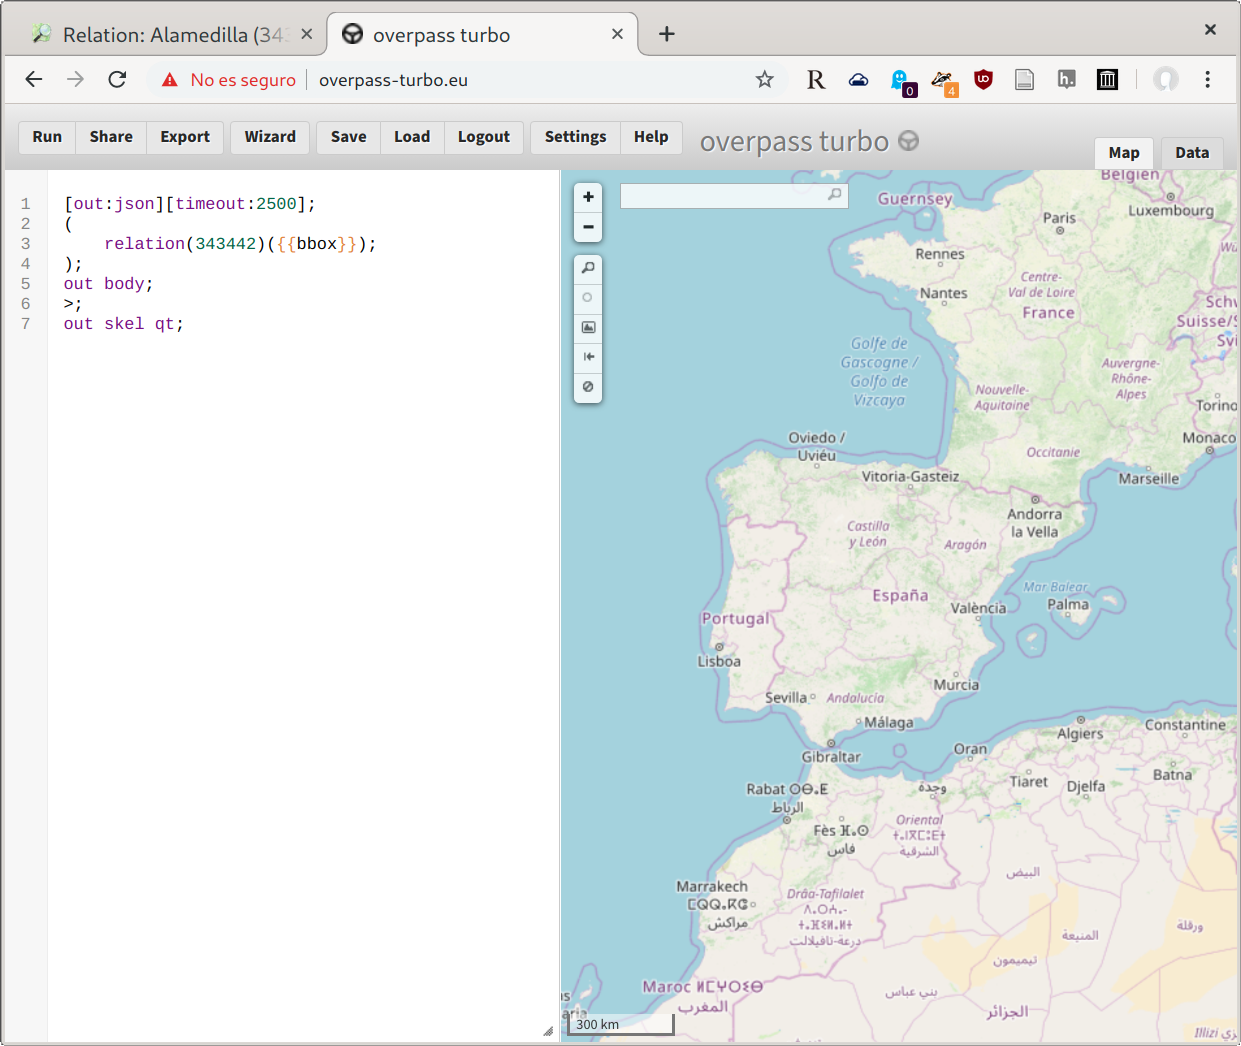
In your case you need to change the 349044 number (used for the Alamedilla’s example) with the relation number you got before. If you modify the query keep in mind the default timeout (25) maybe is not enough for your case.
Now, clicking the Run button you’ll execute your query. Keep in mind the resulting data set could be really big, depending how big the area is.
So, here it is:
Zoom the map to have a better view:
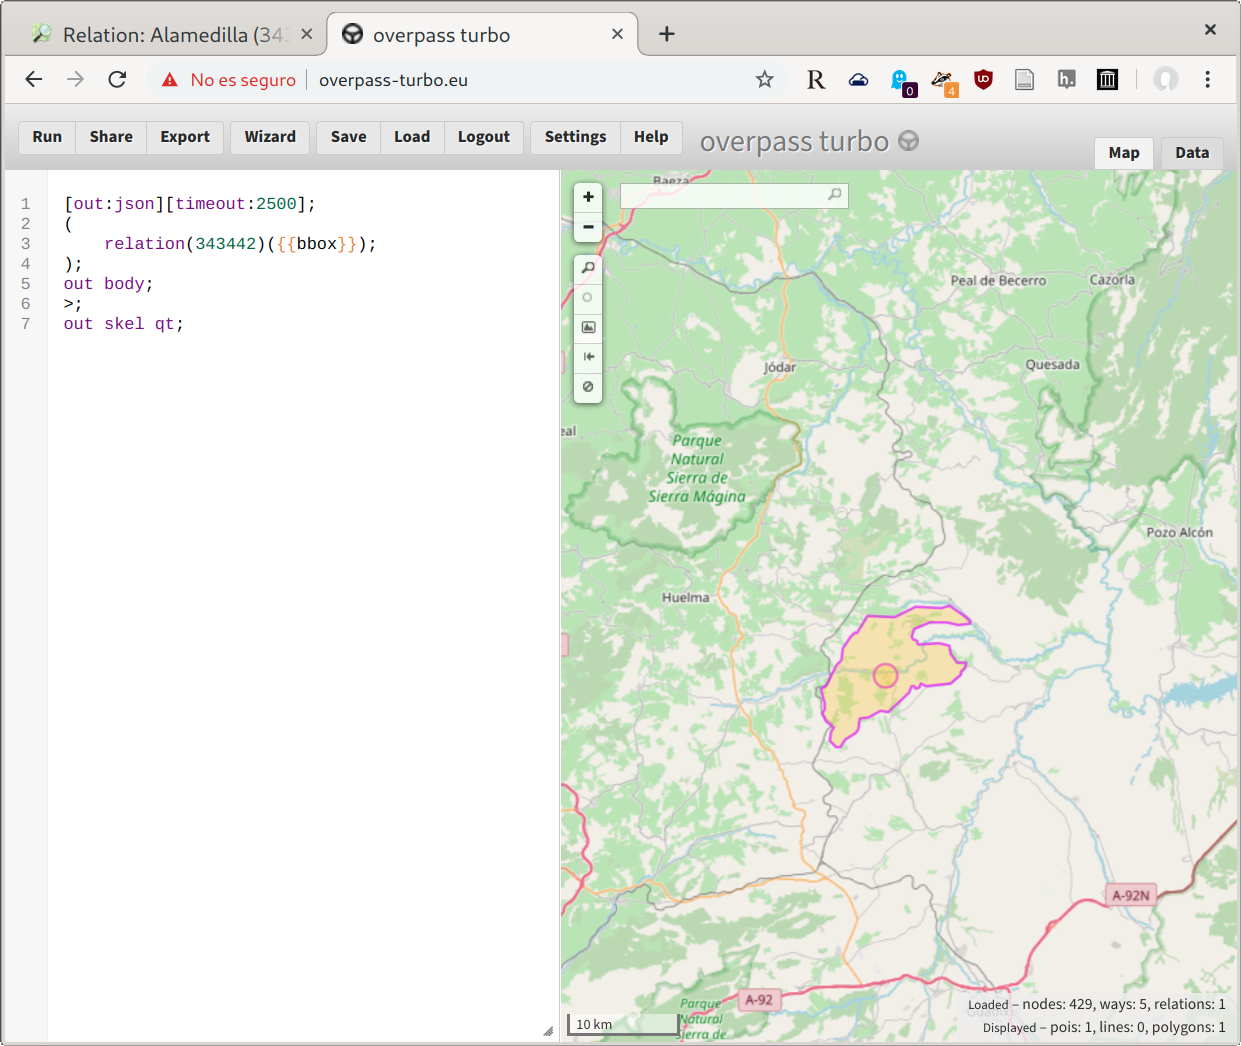
Now you’ll find the resulting data set in GeoJSON format ready at the Data tab (right side). If this format is fine for you you are done. But if you need some other you are lucky enough because when clicking into Export button you’ll find some other formats to export: GPX, KML and OSM data.
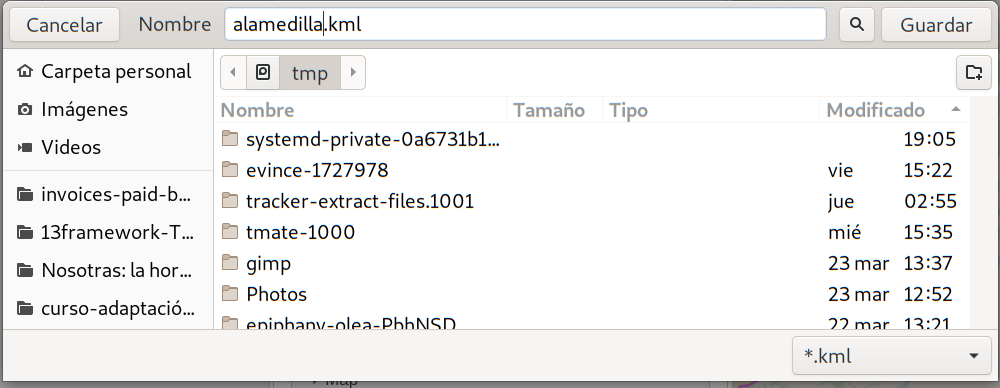
In this example we’ll use the KML format used by Google Earth, Maps and many others.
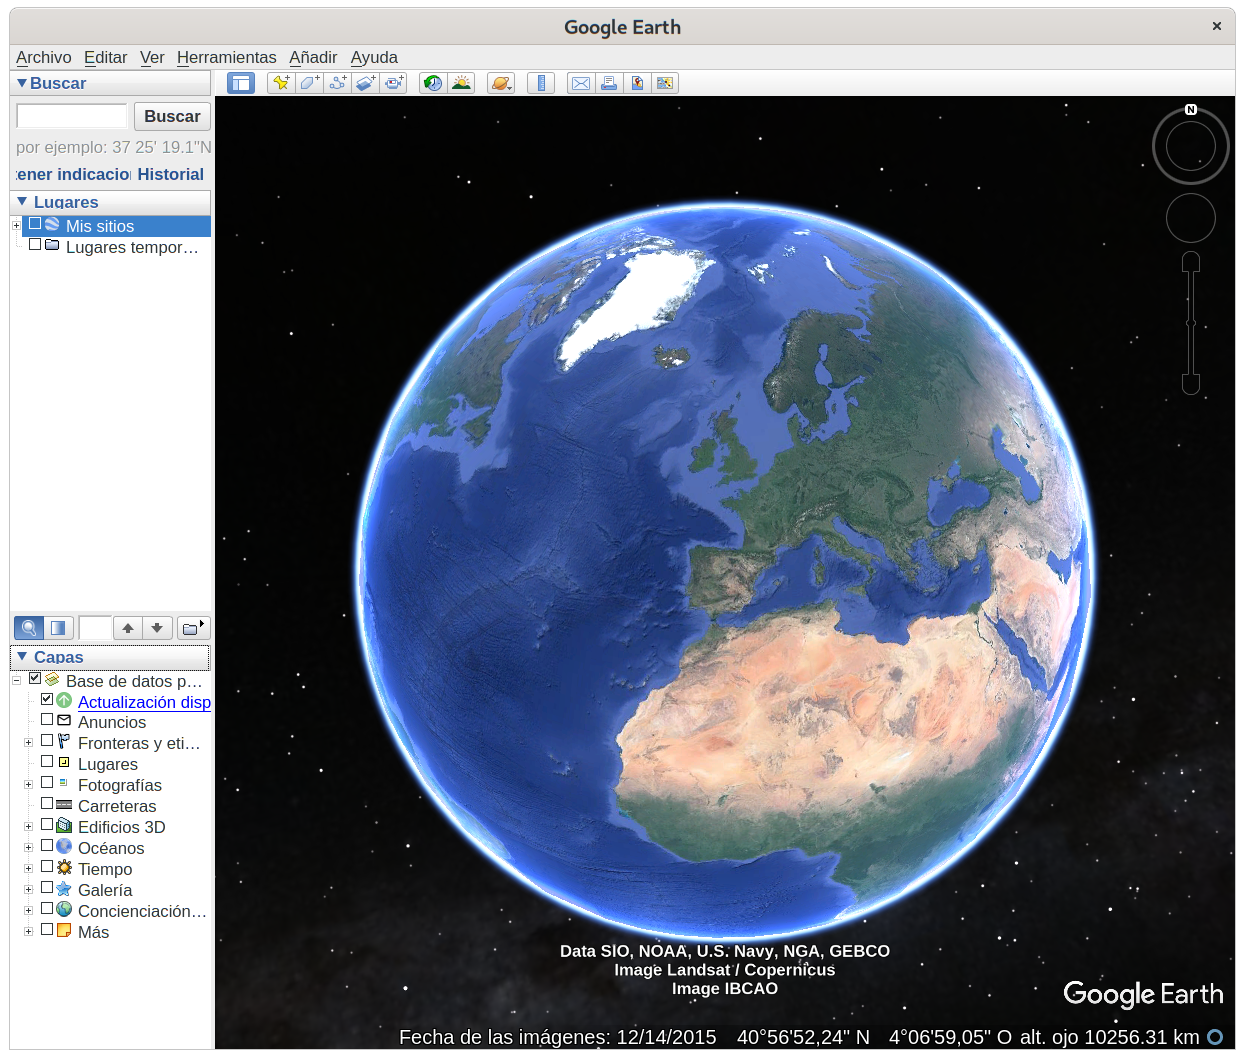
importing into Google Earth
Open Google Earth:
and open our kml file: [File][Open]:
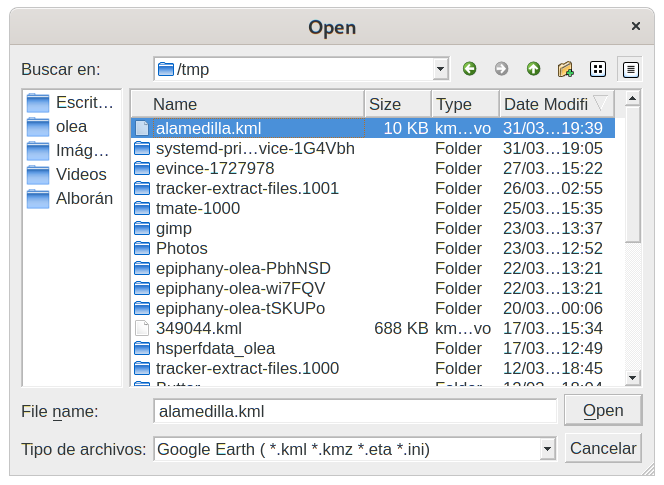
and here it is:
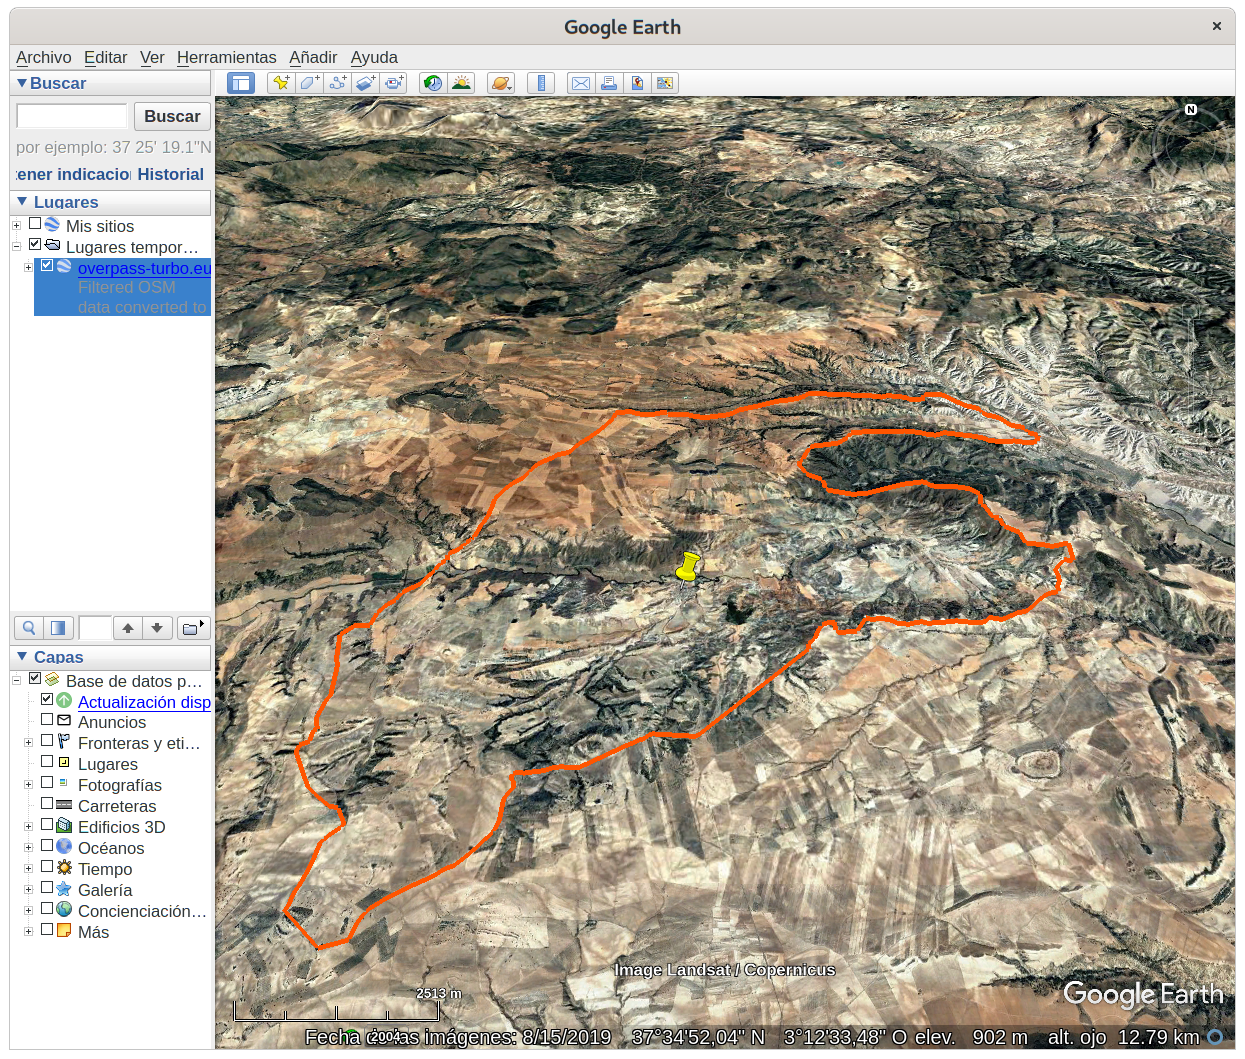
Note: I modified the color (at the object properties) to make it more visible in the screenshot.
So, it is done. Now you can use the kml file in your application, import to any GIS software or convert to another format if required.
importing into Google Maps
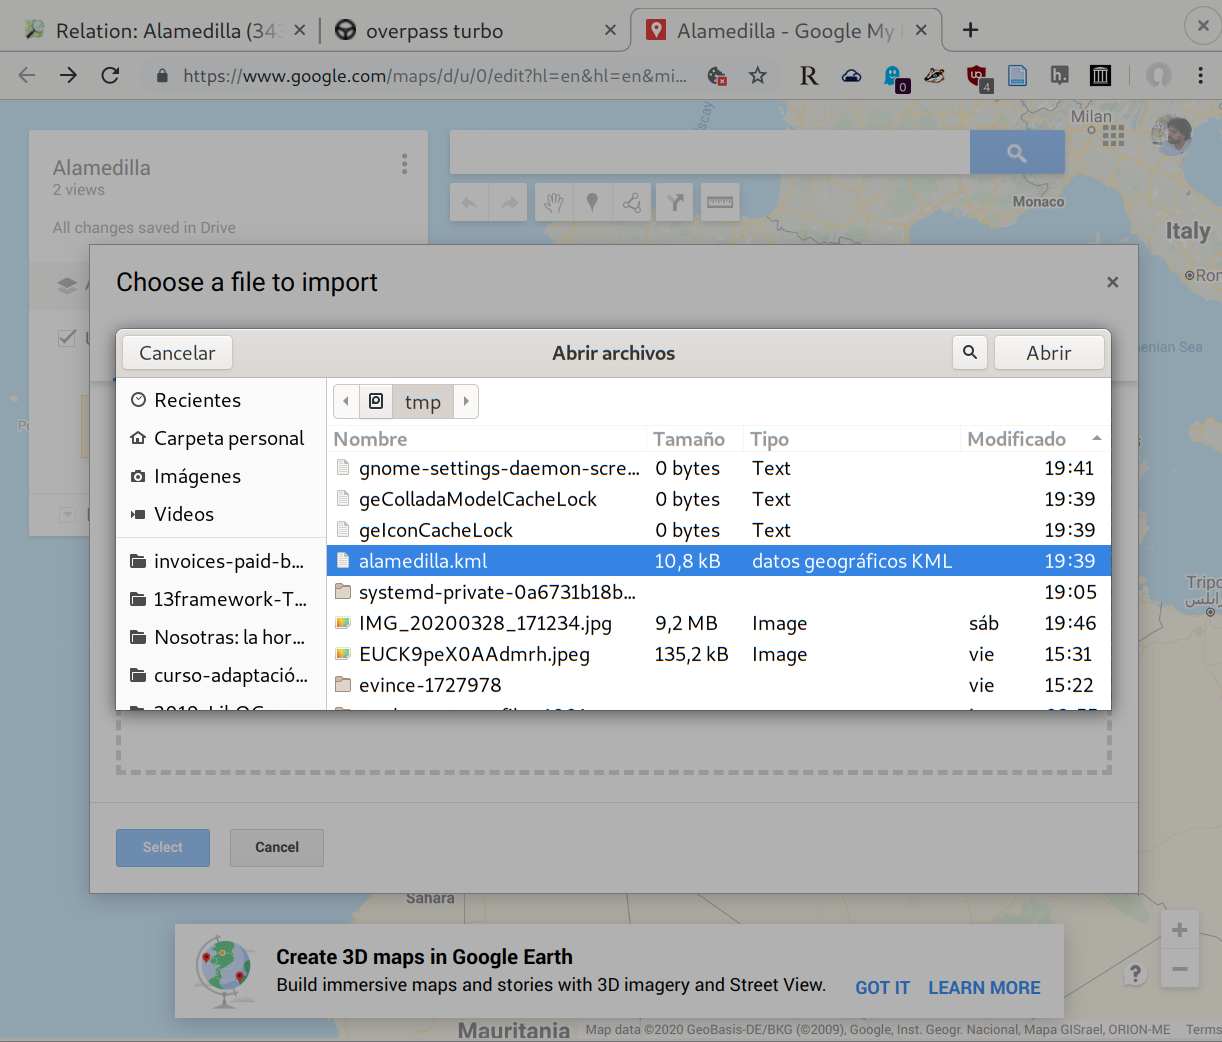
Go to Google MyMaps and create a new one. Import a new layer an select your kml file:
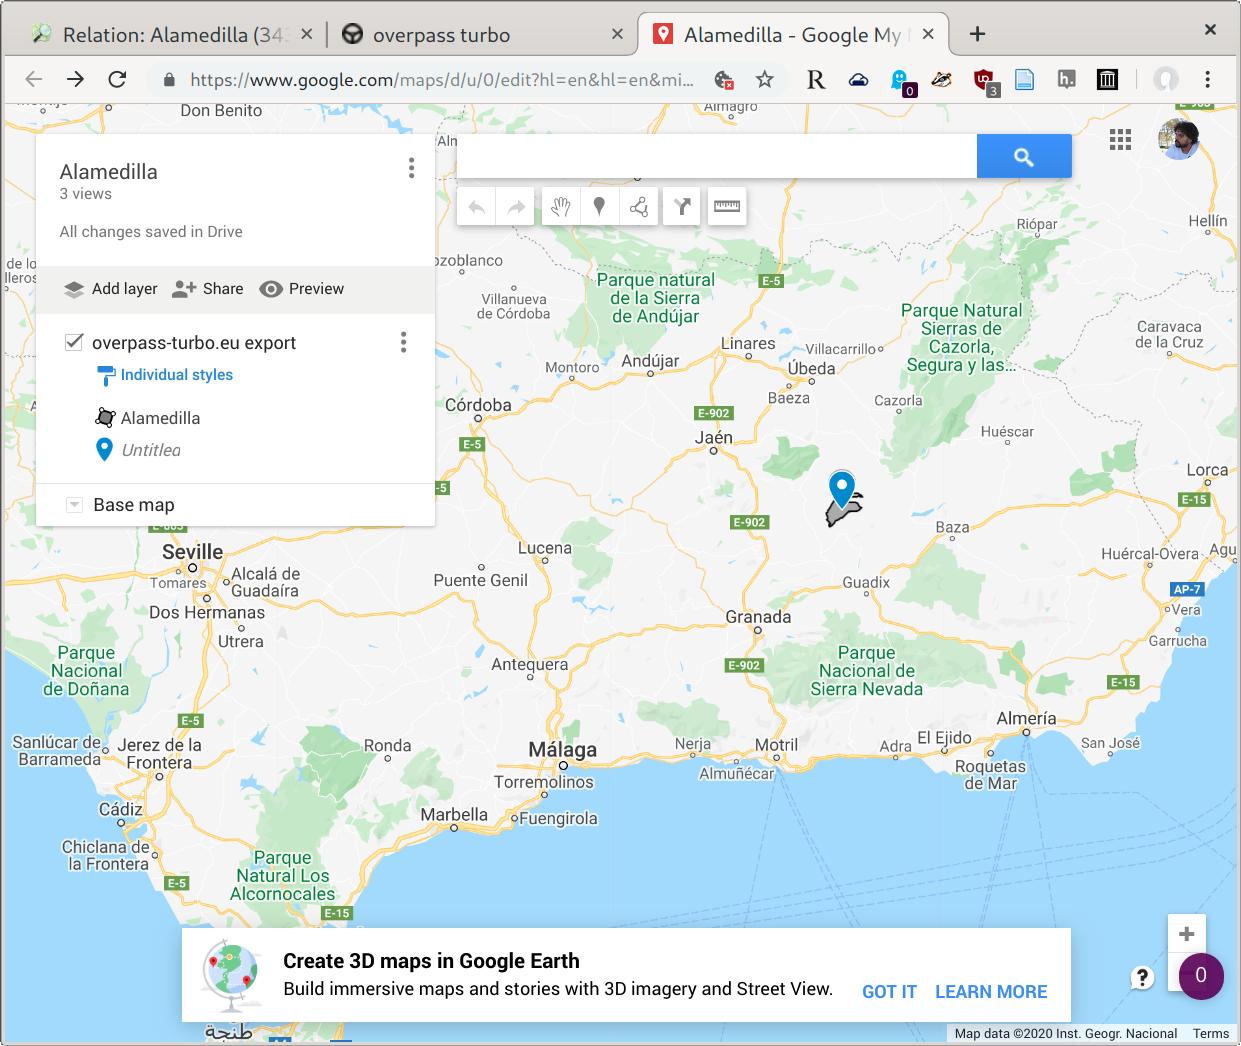
Here it is:
conclusion
Now you are able to create maps of any region added into OpenStreetMap, export them to any of the said formats and import into your applications. Hope this helps.
If you finally use data from the OSM project remember to add the correct credits:
We require that you use the credit “© OpenStreetMap contributors”.
See credit details at osm.org/copyright.
This is an example of how AWESOME OpenStreetMap is and the extraordinaire work these people does. Big thanks to all of the contributros for these impressive service.